
The SubC Streaming Service Web Utilization UI is where Users can view their Presentations usage details.
Open the SubC Streaming Service web application

Click Menu → Utilization
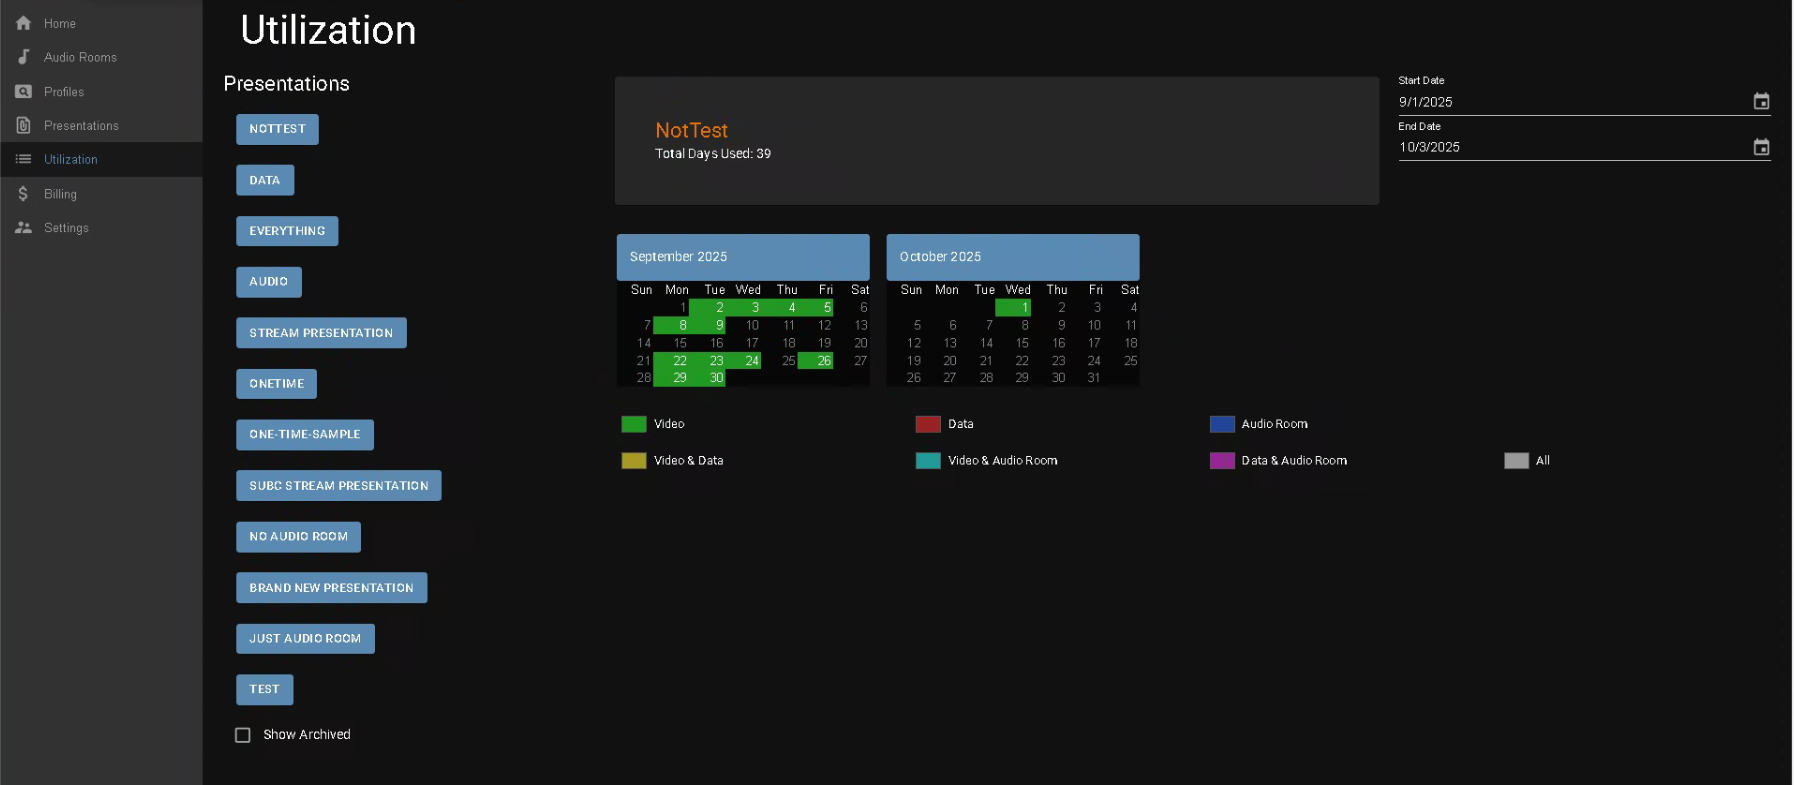
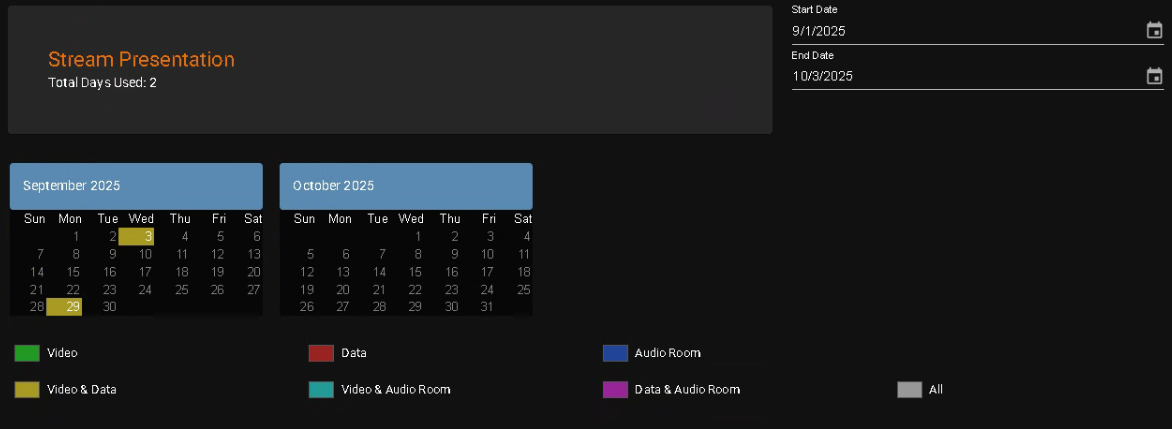
The Color Key below gives a visual indication of which Presentations features were utilized and on which days on the selected Presentation.
In the above example, Video & Data were utilized in the “Stream Presentation” on Sept 3rd & 29th
-
Select the Group for which you wish to view Presentations utilization activity.
-
Presentations - column lists Presentations created in this Group
-
Click on a Presentation to view that Presentation utilization activity. The details for the selected Presentation appear in the center of the page.
-
-
Show Archived - checkbox to reveal/hide Presentations that have been archived.
When you Delete a Presentation, it is removed from the Presentations view, but it is actually not deleted, just moved into the Archive. This way you can still see the utilization of an old/archived Presentation. -
Total Days Used: [sum] calculates the sum of all the days the current selected Presentation has been used over the selected period of time, based on the Start Data and End Date field values.
-
Months are displayed based on the dates you select in the Start Date and End Date fields. The default shows the previous and current Month.
-
Start Date and End Date fields, at the top, right, allow you to change the Months displayed.
SubC Presentations are billed a per diem rate for each day/each Presentation as they are used. The SubC application does not calculate based the number of hours each Presentation(s) has been running, or if multiple start/stops occurred during any given day.
Whether you run a Presentation for just 1 hour or for 24 hours on any given day this will be counted as just one utilization.
Note: Internal Presentations are intended for testing prior to live projects and contain the SubC Watermark.
Contact Sales@subcimaging.com if you have questions pertaining to Utilization Billing.